
Welcome
I’m Linda, a climate scientist dedicated to making sense of extreme weather and our changing climate.
Here you’ll find my professional work, research, teaching, and ongoing projects — all rooted in a commitment to clear, evidence-based science.
I share insights, articles, and explainers that break down complex climate topics into accessible, engaging stories for anyone who wants to understand what’s happening to our planet — and why it matters.
Explore, read, and discover how my work connects science with real-world action.


Latest Blog Post:
- Tipping Point of AMOC Expected in 2060: New Study Shows
A new study led by my colleague René van Westen investigates the future of the Atlantic Meridional Overturning Circulation (AMOC) — the great conveyor belt of ocean currents that moves warm water northward and returns colder, denser water southward at depth. This circulation plays a crucial role in regulating Earth’s climate, including weather patterns in Europe and Africa, the strength of monsoons, and sea level along the Atlantic coasts.
Why is AMOC important?
The AMOC transports heat from the tropics towards the north. This means the current redistributes heat, keeping northern Europe relatively mild compared to other regions at the same latitude, such as western Canada.
We already know from observations that the AMOC has been slowing down. A collapse would cause heat to remain where it is instead of spreading across a larger region. This would lead to: a colder climate in northwestern Europe, stronger storms in some regions, drought in others, and disruptions to ecosystems on land and in the ocean.
A weakening or collapse of AMOC would not raise sea levels evenly everywhere. Instead, it would cause increased sea level across the northern regions of the Atlantic, especially along the U.S. East Coast and parts of northwestern Europe.
What does the new study show?
Using climate model simulations and statistical indicators of stability (early warning signals of approaching tipping points), the researchers estimate when AMOC might cross a critical threshold. Their results suggest that under continued greenhouse gas emissions, the tipping point could be reached as early as 2060.
In their analysis, the collapse happens after around 2.5 °C of global warming. That means AMOC breaking is not inevitable — if we reduce emissions and limit warming, we can prevent crossing this threshold.
Crossing the tipping point would mean that the AMOC circulation weakens beyond recovery. In other words:
➡️ It cannot be fixed once passed.
➡️ Crossing the tipping point is permanent.Public attention in the Netherlands
The research received wide attention here in the Netherlands. My colleague René was interviewed by the national news program Nieuwsuur 📺. The AMOC story runs from 28:45 to 34:42 in the episode of 26 August 2025, which you can watch here (in Dutch):
👉 Nieuwsuur episodeFor those who want to dive into the science itself, the peer-reviewed article is available open access:
👉 Geophysical Research Letters (2025)Why it matters
This study highlights how tipping points in the Earth system are not distant possibilities, but real risks that may occur within our lifetimes. The precise timing is uncertain — but the message is clear: limiting warming below 2.5 °C keeps the AMOC safe. Acting now gives us the chance to prevent a permanent and dramatic shift in our climate system.
- 🚨 New paper highlight: Spectrally nudged storylines in extreme event attribution
A brand new paper by Frauke Feser and Ted Shepherd has just been published:
“The concepts of spectrally nudged storylines for extreme event attribution” (Nature Communications Earth & Environment, 2025)I really enjoyed reading it. The paper is clearly explaining a concept that can often feel quite technical. It covers:
- What spectrally nudged storylines (SN storylines) actually are
- Their purpose and scientific foundation
- The difference between storylines and scenarios
- How SN storylines relate to other conditional attribution methods
- The way forward, how SN storylines can be used in the future
All of this is presented with scientific depth, but in a succinct and accessible way.
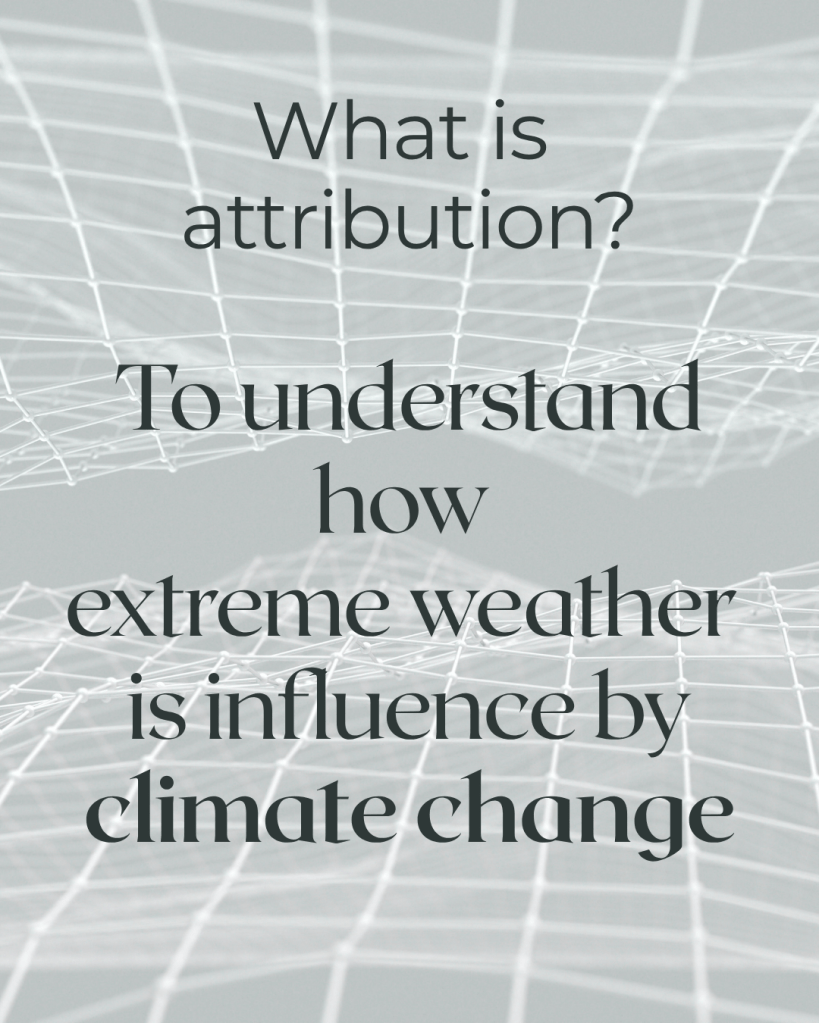
Why it matters
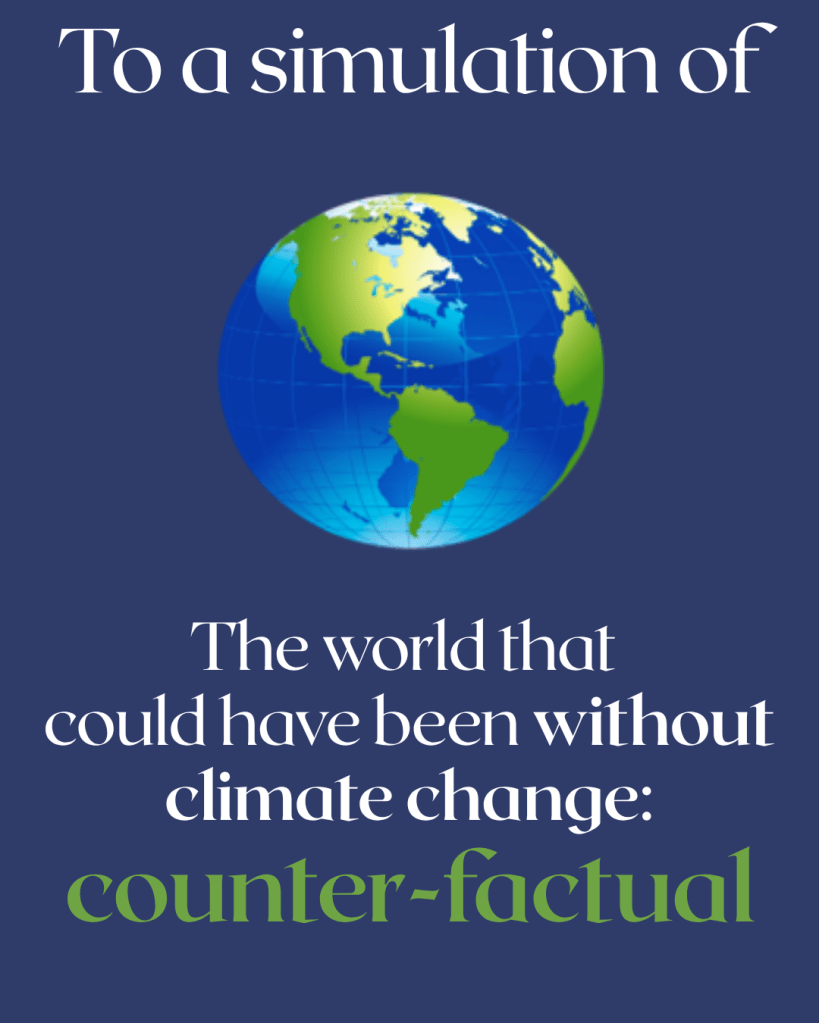
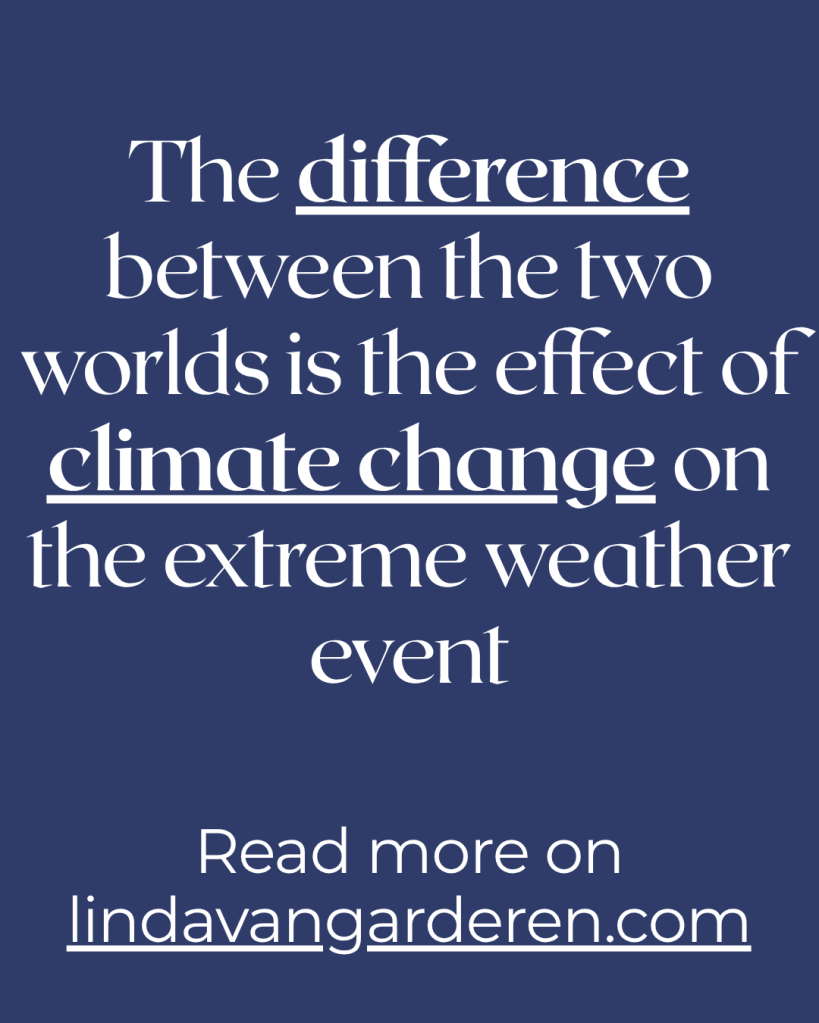
Extreme event attribution (EEA) is about understanding the role of climate change in today’s extreme weather events. Different methods exist, each with their strengths and limitations. Spectrally nudged storylines are particularly powerful because they allow us to explore how the same event would unfold in different climate states.
The method works by constraining atmospheric dynamics (using spectral nudging) while letting thermodynamics evolve freely. In practice, this means:
- You can isolate the thermodynamic effects of climate change (e.g. warming, moisture changes).
- You can keep the meteorological “story” of the event intact, which makes results easy to interpret and communicate.
- It is especially suited for studying extremes like heatwaves, droughts, heavy rainfall, and tropical storms.
The Way Forward
What excites me most is not just what spectrally nudged storylines can already do, but where the field is heading. The concepts outlined by Feser & Shepherd fit into a much bigger picture of how attribution science is evolving, here a small selection:
From hazard to impact attribution.
Until now, most attribution work has focused on the meteorological hazard (e.g. heat, rainfall). The next step is linking directly to impacts — how those hazards translate into damages, health effects, or ecosystem responses. Storyline methods, because of their clarity, are well suited for this bridge.Bridging storylines and probabilistic approaches
The attribution community has sometimes been divided between conditional storylines and unconditioned probabilistic frameworks. In reality, these methods are complementary. By applying statistical analysis on a collection of events in the SN storylines, a bridge between the two methods can be build.The role of AI
New machine learning and AI tools can support attribution by uncovering nonlinear relationships and hidden drivers of extreme weather events. Projects such as CLINT and XAIDA are already exploring how AI can enhance climate storylines, improve uncertainty quantification, and accelerate analysis.Spectrally nudged storylines are therefore not just another method in the toolbox — they are a key stepping stone toward a more integrated and collaborative future in attribution science.
- It’s not just hot—it’s muggy: Wet-bulb heat risk for 12 Aug 2025 in the Benelux
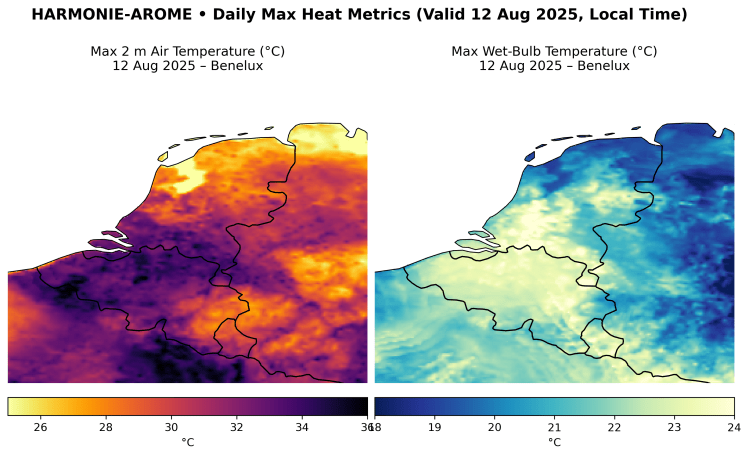
Hot vs. muggy. Left: the day’s hottest 2 m air temperatures. Right: wet-bulb temperature, which blends heat + humidity to show how easily we can cool by sweating—higher values feel heavier and raise heat-stress risk. (12 Aug 2025, local time.) Data: KNMI / UWC-West HARMONIE-AROME Cy43. Method: WBT from T₂m + RH₂m (Stull, 2011). Map & processing: Linda van Garderen. Code: Python Code Above you see the predictions for tomorrow: on the left the maximum temperature, and on the right the maximum wet-bulb temperature. The latter is very interesting, because it shows whether we might experience the day as simply warm or as muggy. The higher the wet-bulb temperature, the more humid it feels and the harder it becomes to evaporate sweat—yes, that sounds a bit disgusting, but it’s a life-saving mechanism our body relies on to maintain a proper core temperature.
A temperature of 33 °C with a wet-bulb temperature of 24 °C means it will be very muggy, which increases the risk of heat stress. A brief overview of how to interpret wet-bulb temperature is below:
WBT (°C) How it may feel Practical guidance Sources ≤ 18 Comfortable; air feels fresh. Evaporative cooling works well. Normal activity for most people. [S1] 18–21 Humid; starts to feel sticky, especially at night. Hydrate; ventilate indoor spaces. [S1] 21–24 Muggy. Strenuous activity feels taxing. Plan shade/rest; increase fluids. [S1][S4] 24–26 Very muggy; heat stress risk rising. Limit hard work; schedule breaks; check on vulnerable people. [S4] 26–28 Dangerous for heavy exertion. Frequent rests; active cooling; consider moving activities indoors. [S4][S5] 28–30 High risk; even light activity can feel oppressive. Short exposures only; monitor symptoms closely. [S4][S5] 30–32 Very high risk. Lab studies show limits near ~31 °C for young, healthy adults under light activity. Strong precautions; seek cool, conditioned spaces. [S5] ≥ 32–35 Critical zone. Approaches theoretical survivability limit (~35 °C). Continuous exposure unsafe; emergency cooling required. [S3][S4] Notes: WBT blends heat and humidity into one number (not the same as WBGT). Sun, wind, clothing, and activity can raise risk at any WBT. Ranges above are practitioner-oriented guidance, not medical standards.
Sources: [S1] AMS Glossary: Wet-bulb temperature. [S2] Stull (2011) JAMC: Wet-bulb from T & RH. [S3] Sherwood & Huber (2010) PNAS: ~35 °C limit. [S4] Raymond et al. (2020) Science Advances: severe impacts well below 35 °C. [S5] Penn State HEAT studies: limits often ~31 °C WBT.
So how does it work, and what does wet-bulb temperature actually mean? Well, in practice it is literally that: a thermometer kept wet (see the image below). What that does is measure the temperature in saturated air. If there’s little humidity in the air, the wet-bulb temperature will be much lower than the air temperature. If it’s humid, though, the two temperatures will be much closer together.
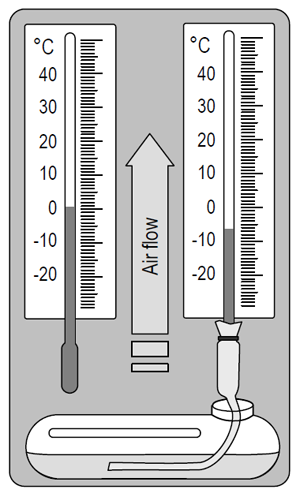
Left: dry-bulb (standard) thermometer measuring the air temperature. Right: wet-bulb thermometer wrapped in a moist wick dipped in water—evaporation cools the bulb, so its reading drops below the air temperature in dry air and sits closer to it when the air is humid.
